Select State Type
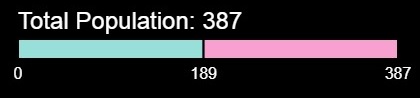
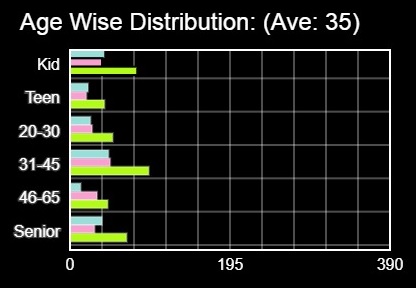
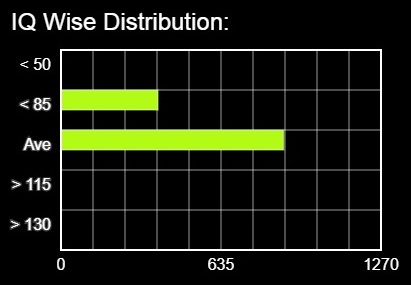
Show Statistics
Long ago I had watched a movie Idiocracy. The reason I remembered the movie is because of its premise.
Over the course of years, generations become dumber and dumber. The base idea being the most intelligent humans to choose not to have children while the less intelligent reproduce indiscriminately. Hmmm... wonder if I can simulate that.
The Rules (based on my assumptions)
- IQ of the child is based on the parents. I know this is far fetched as in reality environment plays a strong role. But for this simulation, it's gonna be the average of both parents, with a slight chance of IQ being a little bit higher than the intelligent of the two parents and conversely same chance of being little bit stupider than the stupidest of the two.
- Partner selection will be based on age and IQ. Again, in the real world we have people with spouses old enough to their granddaughter. Also, people marry just for money or looks. But not in this simulation.
- Giving birth to an offspring also depends on factors like current job of the parents, etc. Basically more intelligent parents will give weightage to their job more than family. This is the golden rule that leads to the basic idea of Idiocracy.
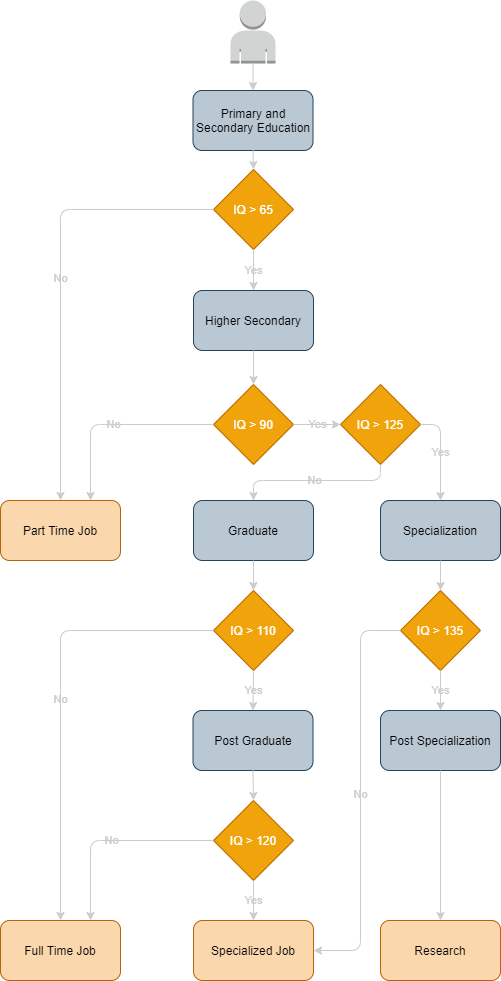
- Education and Job do somewhat depend on the IQ. For example, to enroll for graduation, you need a certain level of IQ. Similarly for specialization you need an even higher IQ. The job you get depends on the education level that you have, so indirectly depend on IQ. This has been detailed out further in The Flow section.
- To control the population from growing indefinitely (don't want the computer to crawl due to sheer calculation), a max cap is set for each state after which a nice 1 child policy kicks in. Also, people die. From a certain age onwards there is a chance of you being fatally ill (this increases with age and at 100 you die). There is also a recovery percentage based on how many researchers and specialized personnel are there in the population.
What's a State?
A state is like a region where the population resides. For this simulation, interstate travel is not possible. So a person born in 1 state lives in that same state for the rest of his/her life along with his/her generations.

The pink and the blue dot pointed out by the red circle represents a single female and a single male in this state. The dots pointed out by the green circle shows a couple. The dots in blue circle shows a family with 2 kids, a boy and a girl.
On the selection of states, the first choice, State of All, has a population cap of 5000 with their IQ range from 55 to 145. This aptly simulates the movie. The average IQ keeps dipping over time.
The second choice is where I separated them out in three groups, the State Names say it all. For each state the population is capped at 2500. While the IQ range of them are [45-75], [80-110] and [120-150] respectively.
The IQ to Education to Job relationship.
In Electronic Life I had used Chart.js to render the data visualization. Here I wrote custom code to render them.
Statistics


Idea from Idiocracy movie.